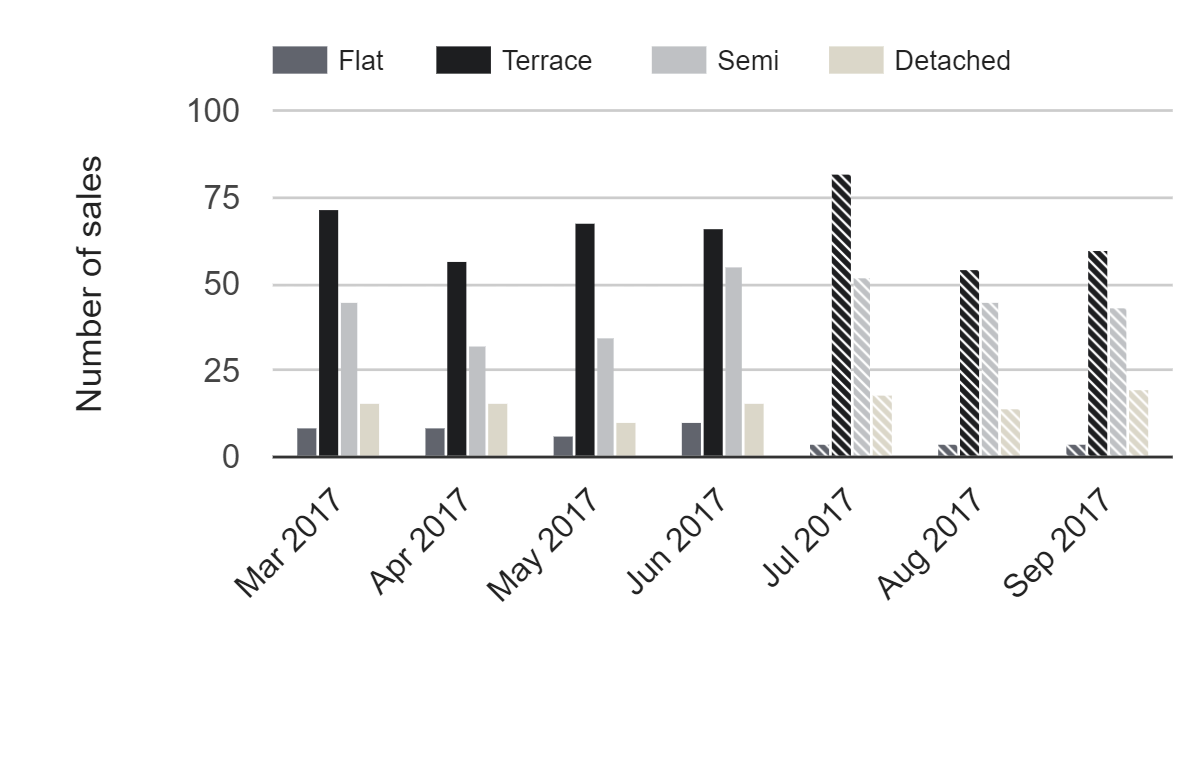
Monthly sales rates by house type

This chart nicely reveals how sales levels have played out over the last seven months in our area. We’re looking at a relatively tight area over relatively short periods of time, so you don’t get the nice smooth patterns you’d see using annualised analyses or at higher levels of geography. The patterns however, are very revealing.
